Thursday, November 3, 2011
Thursday, October 20, 2011
Thursday, September 22, 2011
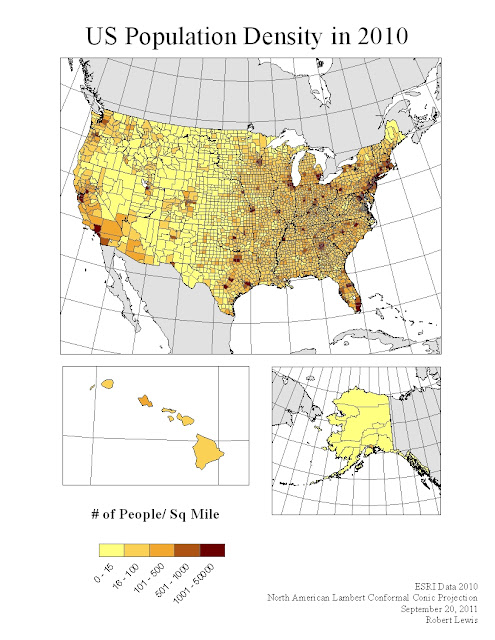
United States Population Density in 2010
This is a map of the United States in 2010, showing population density data by county. Other countries and a graticule are set in lighter shades of grey, and the oceans and Great Lakes are shown in white. This is a chloropleth map, shading the American counties in shades from lighter to darker based on lesser to greater magnitudes of population density. The map provides a legend for the data classification.
Map of the United States of America
This is a map of the United States of America, set in dark grey, with state and national borders in black. The map includes the non-contiguous states of Alaska and Hawaii in separate data frames and a graticule in all three data frames. The map sets the country in context of the North American continent, showing the neighboring countries in a lighter shade of grey, and the surrounding oceans and the Great Lakes in white.
Map of Utah
This is a map of the state of Utah (colored green) with the states surrounding it shown in a lighter shade. The capital, Salt Lake City, is marked and both it and the state are labeled by name in white. This map allows for a basic, simple depiction of the state, putting it in partial context of the surrounding region.
Subscribe to:
Comments (Atom)


